开启
long_query_time = 1 # 慢查询的限制时间,即大于此时间的会记录
slow_query_log = ON # 开启慢查询日志
slow_query_log_file = /tmp/mysql-slow.log # 慢查询的日志文件
状态检查
show variables like "%long_query_%"
show status like "%slow_quries%"
show variables like "%slow%'
分析 --> mysqldumpslow
参数:
--verbose    verbose
--debug      debug
--help       write this text to standard output
-v           verbose
-d           debug
-s ORDER     what to sort by (al, at, ar, c, l, r, t), 'at' is default
                 al: average lock time
                 ar: average rows sent
                 at: average query time
                  c: count
                  l: lock time
                  r: rows sent
                  t: query time
-r           reverse the sort order (largest last instead of first)
-t NUM       just show the top n queries
-a           don't abstract all numbers to N and strings to 'S'
-n NUM       abstract numbers with at least n digits within names
-g PATTERN   grep: only consider stmts that include this string
-h HOSTNAME  hostname of db server for -slow.log filename (can be wildcard),                default is '', i.e. match all
-i NAME      name of server instance (if using mysql.server startup script)
-l           don't subtract lock time from total time
例子
mysqldumpslow -s c -t 10 host-slow.log # 记录次数最多的10个
mysqldumpslow -s r -t 10 host-slow.log # 结果集最多的10个
mysqldumpslow -s t -t 10 -g "left join" host-slow.log
# 按照时间返回前10条里面含有左连接的sql语句
具体说明
mysqldumpslow -s at -t 5 mysql-slow-chonggou-mysql-2019061007.log
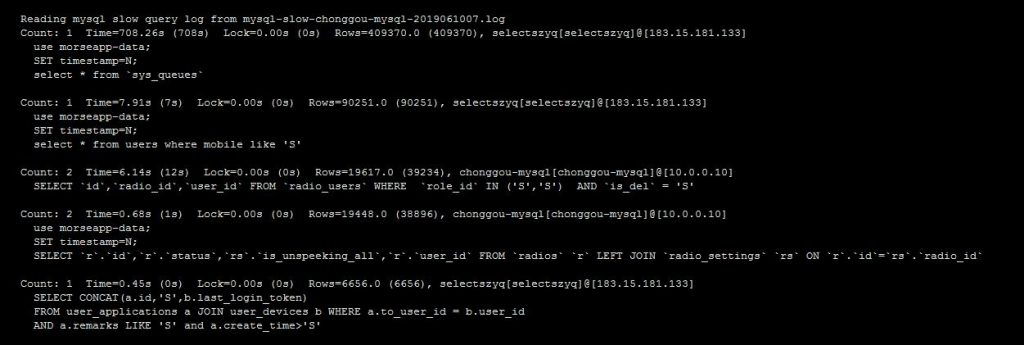
Count: 2 Time=6.14s (12s) Lock=0.00s (0s) Rows=19617.0 (39234), chonggou-mysql[chonggou-mysql]@[10.0.0.10]
SELECTid,radio_id,user_idFROMradio_usersWHERErole_idIN ('S','S') ANDis_del= 'S'
- Count : 执行次数
- Time : 平均查询时间 (总计)
- Lock : 平均锁定时间 (总计)
- Rows : 平均响应结果集 (总计)
- chonggou-mysql[chonggou-mysql]@[10.0.0.10] 主机信息
- 最后就是执行的语句